|
<< Click to Display Table of Contents >> Chronic Patients |
  
|
|
<< Click to Display Table of Contents >> Chronic Patients |
|
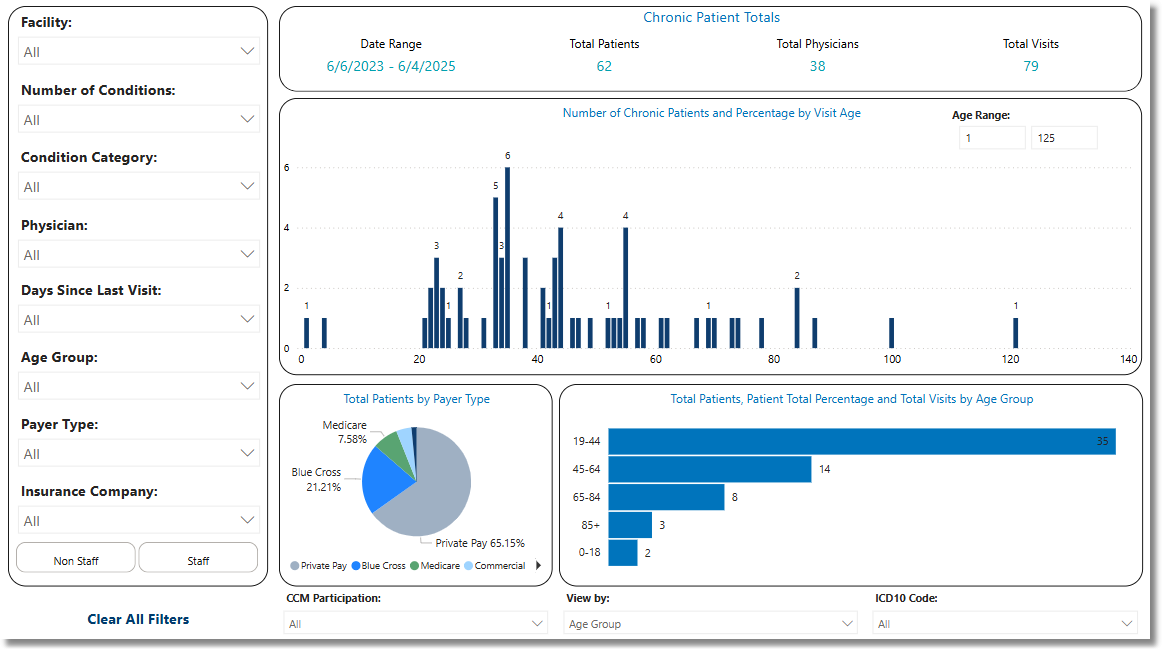
The Chronic Patients Dashboard provides insights into the chronic patient population to support improved patient outcomes, strengthen patient–provider communication, promote self-management, and enhance the quality of life for individuals living with chronic conditions. This dashboard can also be used to support Chronic Care Management (CCM) initiatives.
The dashboard displays the number of patients with chronic condition(s), the number of corresponding physicians, and the total number of visits over the past two years. Additionally, it provides a breakdown of chronic patients and percentages by visit age, payer type, and age group.
Select Web Client > Report Dashboard > Interactive Reports & Dashboards > Chronic Patients
Chronic Patients
Metrics
•Date Range: The Admit Date Range for which data is being displayed.
•Total Patients: The number of living patients who have a chronic condition and an Admit Date within the Date Range.
•Total Physicians: The number of physicians who have seen a chronic patient within the Date Range.
•Total Visits: The number of visits by chronic patients within the Date Range.
Filters
Filters can be applied to refine the dashlet totals. Each filter features a drop-down menu with a built-in search field, allowing for efficient selection of specific criteria.
•Facility: Use the drop-down menu to select a specific facility.
•Physician: Use the drop-down menu to specify a Physician.
•Staff / Non Staff: Select the staffing preference.
•Days Since Last Visit: Use the drop-down menu to select a number of days range.
•Payer Type: Use the drop-down menu to select a specific Payer Type.
•Health Plan: Use the drop-down menu to further evaluate Payment Type. If a facility does not use this field, it will display as blank.
•Insurance Company: Use the drop-down menu to select a specific Insurance Company.
•Stay Type: Use the drop-down menu to select a specific Stay Type.
•Sub Type: Use the drop-down menu to select a specific Sub Type.
•Service Code: Use the drop-down menu to select a specific Service Code.
•Clear All Filters: Select this option to clear all previously applied filters.
NOTE: If no filters are selected, the data will populate using the default setting of All.
Slicers
The following slicers are available to further refine the data displayed in the corresponding dashlets:
•Age Range: Use the fields to enter an age range for the data populating in the "Total Patients by" dashlet.
•View by: Select an option to change the data populated in the "Total Patients by" dashlet:
▪Condition Category
▪Physician
▪Age
▪Age Group
▪Gender
▪CCM Participation
▪Days Since Last Visit
▪Number of Conditions
▪Insurance Company
▪Stay Type
▪Sub Type
▪Service Code
•CCM Participation:
▪Select All
▪Declined
▪Not Addressed
▪Participating
•Age Group:
▪Select All
▪0-18
▪19-44
▪45-64
▪65-84
•Number of Conditions:
▪Select All
▪1
▪2
▪3
▪4
▪5
▪10
•View by:
▪Condition Category
▪ICD10 Code
▪Physician
▪Age Group
▪Gender
▪CCM Participation
▪Days Since Last Visit
▪Number of Conditions
▪Insurance Company
•ICD10 Code