|
<< Click to Display Table of Contents >> Lab Average Turnaround Time |
  
|
|
<< Click to Display Table of Contents >> Lab Average Turnaround Time |
|
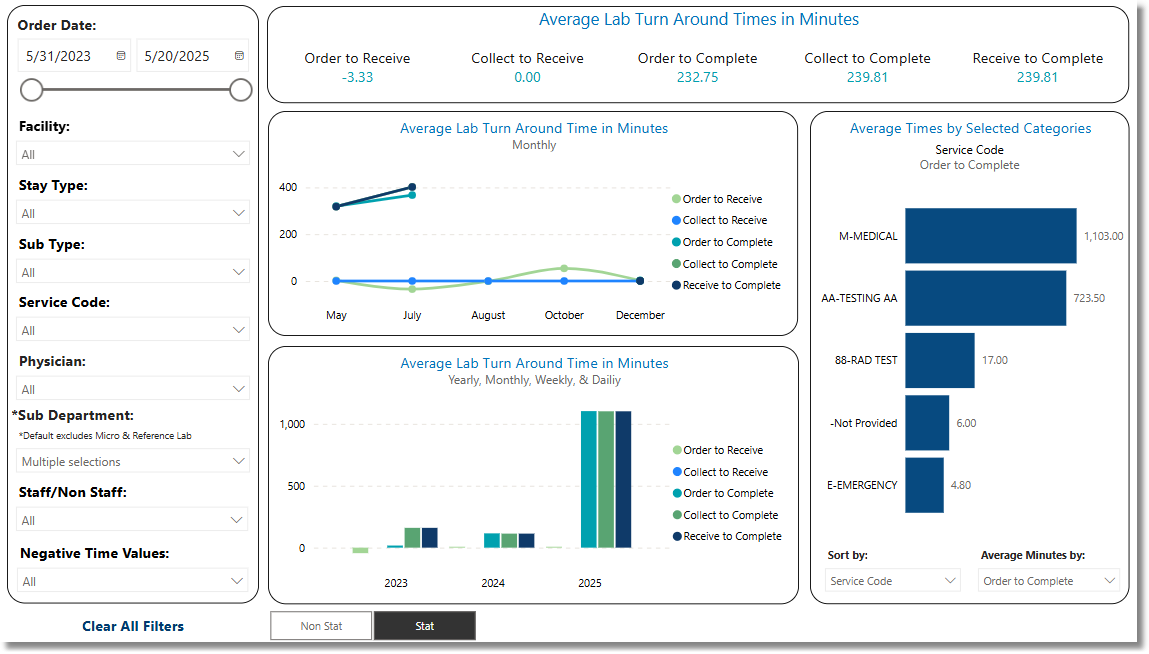
The Lab Average Turnaround Time Dashboard presents average turnaround times for each phase of the lab order process: Order to Receive, Collect to Receive, Order to Complete, Collect to Complete, and Receive to Complete, for both Stat and Non-Stat lab orders. Metrics are calculated based on the specified Order Date range.
Select Web Client > Report Dashboard > Interactive Reports & Dashboards > Lab Dashboard > Lab Average Turnaround Time
Lab Average Turnaround Time
Filters
Filters can be applied to refine the data displayed. Each filter features a drop-down menu with a built-in search field, allowing for efficient selection of specific criteria.
•Order Date: Use the calendar or slider to select a specific Order Date Range.
•Facility: Use the drop-down menu to select a specific facility.
•Stay Type: Use the drop-down menu to select a specific Stay Type.
•Sub Type: Use the drop-down menu to select a specific Sub Type.
•Service Code: Use the drop-down menu to select a specific Service Code.
•Physician: Use the drop-down menu to select a specific Physician.
•*Sub Department: Use the drop-down menu to select a specific Sub Department. (Default excludes Micro & Reference Lab)
•Staff/Non Staff: Use the drop-down menu to select staff preferences.
•Stat Order: Use the drop-down menu to select Non Stat, Stat, or Both orders.
•Include Negative Turn Around Time Duration: Select this option to include negative turnaround time durations.
•Include Positive Turn Around Time Duration: Select this option to include positive turnaround time durations.
•Clear All Filters: Select this option to clear all previously applied filters.
NOTE: If no filters are selected, the data will populate using the default setting of All.
Slicers
The following slicers are available to further refine the dashlets:
•Item Description
•Stay Type
•Sub Type
•Service Code
•Physician
•Stat Order
•Sub Department