|
<< Click to Display Table of Contents >> Totals by Date |
  
|
|
<< Click to Display Table of Contents >> Totals by Date |
|
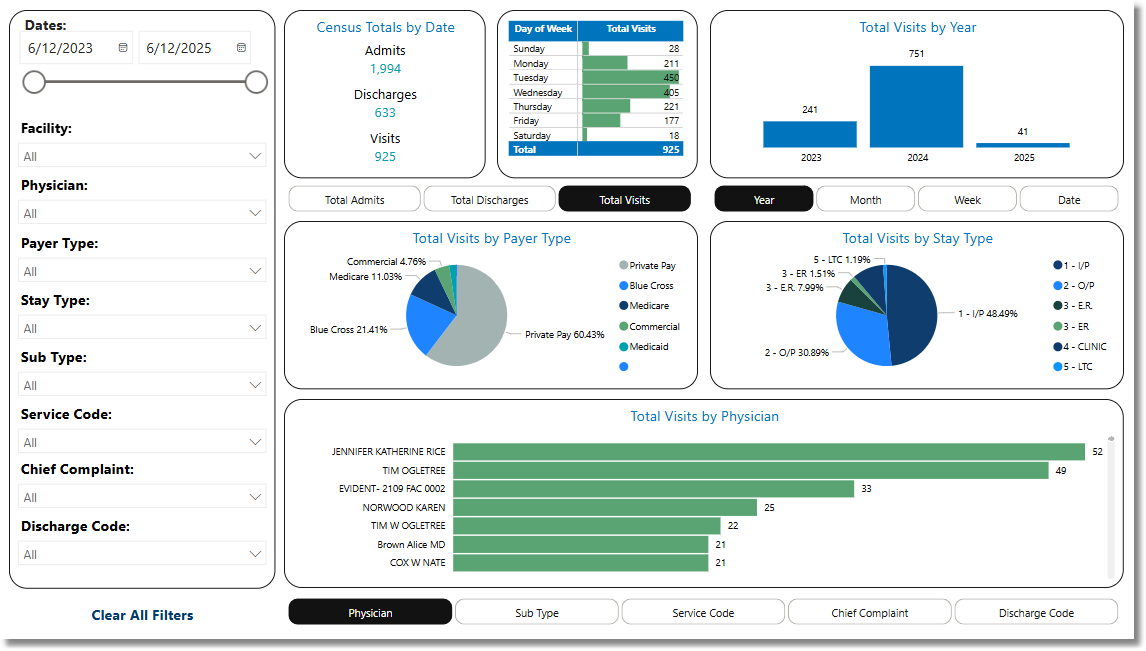
The Totals by Date Dashboard provides insights into the number of visits within an Admit Date Range for the facility. Total number of visits are broken down by Payer Type, Stay Type, Physician, Service Code, Sub Type, Discharge Code, Chief Complaint, and Discharge Code.
Select Web Client > Report Dashboard > Interactive Reports & Dashboards > Totals by Date
Totals by Date
Metrics
•Admits: The total number of visits with an Admit Date within the specified date range.
•Discharges: The total number of visits with a Discharge Date within the specified date range.
•Visits: The total number of visits with a Service Date within the specified date range.
Filters
Filters can be applied to refine the dashlet totals. Each filter features a drop-down menu with a built-in search field, allowing for efficient selection of specific criteria.
•Admit Date: Use the calendar or slider to specify an Admit Date range to be used.
•Facility: Use the drop-down menu to select a specific facility.
•Physician: Use the drop-down menu to select a specific physician.
•Payer Type: Use the drop-down menu to select a specific category of Payer. This groups patients by the type of coverage rather than by the specific company.
•Insurance Company: Use the drop-down menu to select a specific Insurance Company.
•Stay Type: Use the drop-down menu to select a specific Stay Type.
•Sub Type: Use the drop-down menu to select a specific Sub Type.
•Service Code: Use the drop-down menu to select a specific Service Code.
•Chief Complaint: Use the drop-down menu to select a specific Chief Complaint.
•Discharge Code: Use the drop-down menu to select a specific Discharge Code.
•Clear All Filters: Select this option to clear all previously applied filters.
NOTE: If no filters are selected, the data will populate using the default setting of All.
Slicers
The following slicers are available to further refine the corresponding dashlets:
•Total Admits
•Total Discharges
•Total Visits
•Year
•Month
•Week
•Date
•Physician
•Sub Type
•Service Code
•Chief Complaint
•Discharge Code