|
<< Click to Display Table of Contents >> Description and Usage |
  
|
|
<< Click to Display Table of Contents >> Description and Usage |
|
The report is divided into four patient sections and two total sections. The four patient related sections are; Demographic Information, DRG Information, Cost Details, and Profit and Loss Information. The two total sections are; Totals by Summary Code, and Totals by DRG. Each totals section contains a Grand Total line at the conclusion. Below is an explanation of each section.
Demographic Information

Listed below is an explanation of each column:
•Name: Pulls from Patient tab on the Registration and ADT screen
•Account#: Pulls from Registration and ADT screen
•MR# (Medical Record Number): Pulls from Patient tab on the Registration and ADT screen
•Admit Date: Pulls from Stay tab on the Registration and ADT screen
•Discharge Date: Pulls from Stay tab on the Registration and ADT screen
•ST (Stay Type): Pulls from Patient tab on the Registration and ADT screen
•Sub Type: Pulls from Patient tab on the Registration and ADT screen
•Service (Service Code): Pulls from Patient tab on the Registration and ADT screen
•FC (Financial Class): Pulls from Guarantor/Ins tab on the Registration and ADT screen
•NS (Nursing Station): Pulls the Nursing Station associated with the Patient's room
•Room: Pulls from Registration and ADT screen
•Attending Physician: Pulls from Stay tab on the Registration and ADT screen
DRG Information

Listed below is an explanation of each column:
•DRG: Pulls from the Grouper.
•SI (Severity Indicator): The severity/mortality indicator only populates when the 3M APR DRG® Software is utilized within the medical records encoder functionality. Valid indicators are 1, 2, 3 and 4.
•Description: Pulls the description of the DRG which pulls from the appropriate DRG table based on Financial Class
•GLOS (Geometric Length of Stay): The GLOS for the DRG listed in the DRG column.
•ALOS (Actual Length of Stay): This value is the calculated number of midnights that a patient is in a bed.
•Diff (Difference): This value is the product of the GLOS minus the ALOS.
•Rel Wt. (Relative Weight): Pulls the relative weight which pulls from the appropriate DRG table based on Financial Class
•Est Reimb (Estimate Reimbursement): Pulls the expected reimbursement associated with the computed DRG
Cost Details
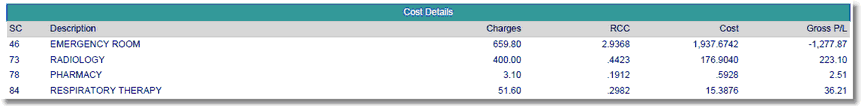
Listed below is an explanation of each column:
•SC (Summary Code): Displays the Summary Code attached to the charge. Summary codes are loaded per item on Page 1 of the Item Master.
•Description: The Summary Code description pulls from the Charge Summary Code table within Table Maintenance.
•Charges: The total charges as calculated within Account Detail for the Summary Code listed.
•RCC (Ratio of Costs to Charges): The RCC pulls from the Summary Code table.
•Cost: The cost is calculated by multiplying the item price listed in the Item Master by the Ratio of Costs to Charges listed in the Charge Summary Code table.
•Gross P/L (Gross Profit & Loss): The Gross P/L is a product of charges minus cost.
Profit and Loss Information

Listed below is an explanation of each column:
•Gross Revenue: The total amount of all charges for all summary codes.
•Reimbursement: The total net payment amounts entered during reimbursement of the primary claim.
•Deductible/Coinsurance: The total net deductible and coinsurance amounts entered during reimbursement of the primary claim.
•Net Payment: Total reimbursement plus total deductible and coinsurance amounts entered during reimbursement of the primary claim.
•Cost: The cost is calculated by multiplying the item price listed in the Item Master by the Ratio of Costs to Charges listed in the Charge Summary Code table.
•Profit/Loss: The product of net reimbursement minus cost.
Totals by Summary Code
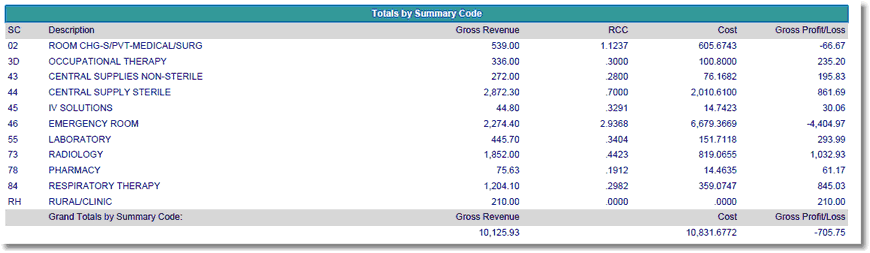
Listed below is an explanation of each column:
•SC (Summary Code): Displays the Summary Code attached to the charge. Summary codes are loaded per item on Page 1 of the Item Master.
•Description: The Summary Code description pulls from the Charge Summary Code table within Table Maintenance.
•Gross Revenue: The total amount of all charges for the summary code listed.
•RCC (Ratio of Costs to Charges): The RCC pulls from the Summary Code table.
•Cost: The cost is calculated by multiplying the item price listed in the Item Master by the Ratio of Costs to Charges listed in the Charge Summary Code table.
•Gross P/L (Gross Profit & Loss): The Gross P/L is a product of gross revenue minus cost.
Grand Totals by Summary Code
•Gross Revenue: The total amount of charges for all summary codes listed.
•Cost: The total amount of costs for all summary codes listed.
•Gross P/L (Gross Profit & Loss): The Gross P/L is a product of total gross revenue minus total cost.
Totals by DRG
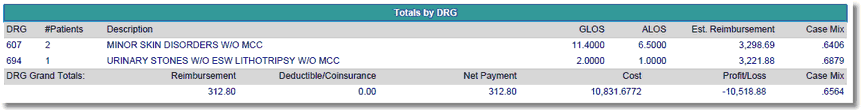
Listed below is an explanation of each column:
•DRG: Lists each DRG that is displayed on the report
•#Patients: The number of patients on the report that displayed the DRG listed in the DRG column.
•Description: Displays the description of the DRG which pulls from the appropriate DRG table based on Financial Class.
•GLOS (Geometric Length of Stay): The GLOS for the DRG listed in the DRG column.
•ALOS (Actual Length of Stay): The ALOS for the DRG listed in the DRG column.
•Estimated Reimbursement: The total expected reimbursement associated with each DRG.
•Case Mix: The case mix is computed by adding the combined total of all relative weights listed on the report divided by the total number of patients/cases.
DRG Grand Totals:
•Reimbursement: The total net payment amounts entered during reimbursement of the primary claim.
•Deductible/Coinsurance: The total net deductible and coinsurance amounts entered during reimbursement of the primary claim.
•Net Payment: Total reimbursement plus total deductible and coinsurance amounts entered during reimbursement of the primary claim.
•Cost: The cost is calculated by multiplying the item price listed in the Item Master by the Ratio of Costs to Charges listed in the Charge Summary Code table.
•Profit/Loss: The product of net reimbursement minus cost.
•Case Mix: The case mix is computed by adding the combined total of all relative weights listed on the report divided by the total number of patients/cases. The grand total case mix utilizes this formula as well, counting each case instead of only summing the total number of DRGs listed on the report.
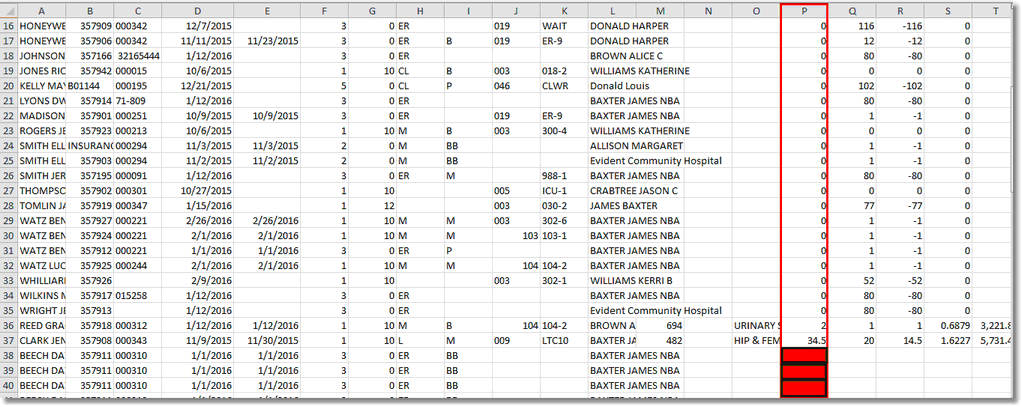
NOTE: When importing this report (without advanced manipulation) into Excel, it is recommended to sort by the "P" column (making sure to extend the sort to all other columns) and then delete any rows where that field is blank. Do not delete rows where a zero is present in the "P" column. This will get rid of all duplicate patient lines without losing any valuable data.