|
<< Click to Display Table of Contents >> CMI Paid DRG |
  
|
|
<< Click to Display Table of Contents >> CMI Paid DRG |
|
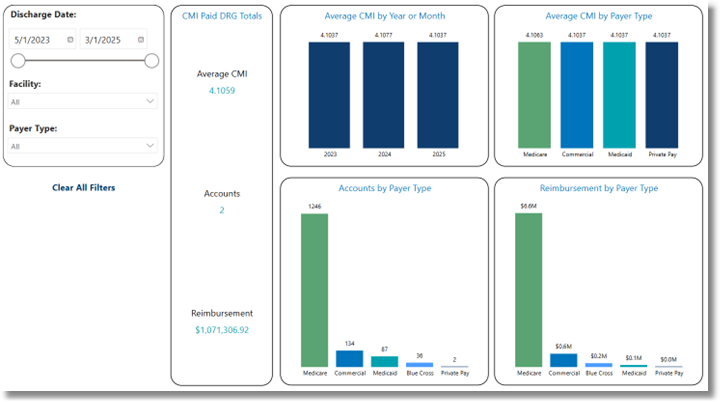
The CMI Paid DRG Dashboard delivers detailed insights into CMI data based on paid DRGs. It displays key metrics including average CMI, total accounts, and total reimbursement. The dashboard also features breakdowns of average CMI by year and month, as well as payer-specific data for average CMI, account volume, and reimbursement amounts.
Select Web Client > Report Dashboard > Interactive Reports & Dashboards > CMI by Billed and Paid DRG > CMI Paid DRG
CMI Paid DRG
Filters
Filters can be applied to refine the data displayed. Each filter features a drop-down menu with a built-in search field, allowing for efficient selection of specific criteria.
•Discharge Date: Use the calendar or slider to select a Discharge Date range.
•Facility: Use the drop-down menu to select a specific facility.
•Payer Type: Use the drop-down menu to select a specific category of Payer. This groups patients by the type of coverage rather than by the specific company.
•Insurance Company: Use the drop-down menu to select a specific Insurance Company.
•DRG: Use the drop-down menu to select a specific DRG.
•Clear All Filters: Select this option to clear all previously applied filters.
NOTE: If no filters are selected, the data will populate using the default setting of All.
Slicers
The following slicers are available to customize the data displayed in the corresponding dashlets:
•Payer Type
•Insurance Company