|
<< Click to Display Table of Contents >> Medication Interventions |
  
|
|
<< Click to Display Table of Contents >> Medication Interventions |
|
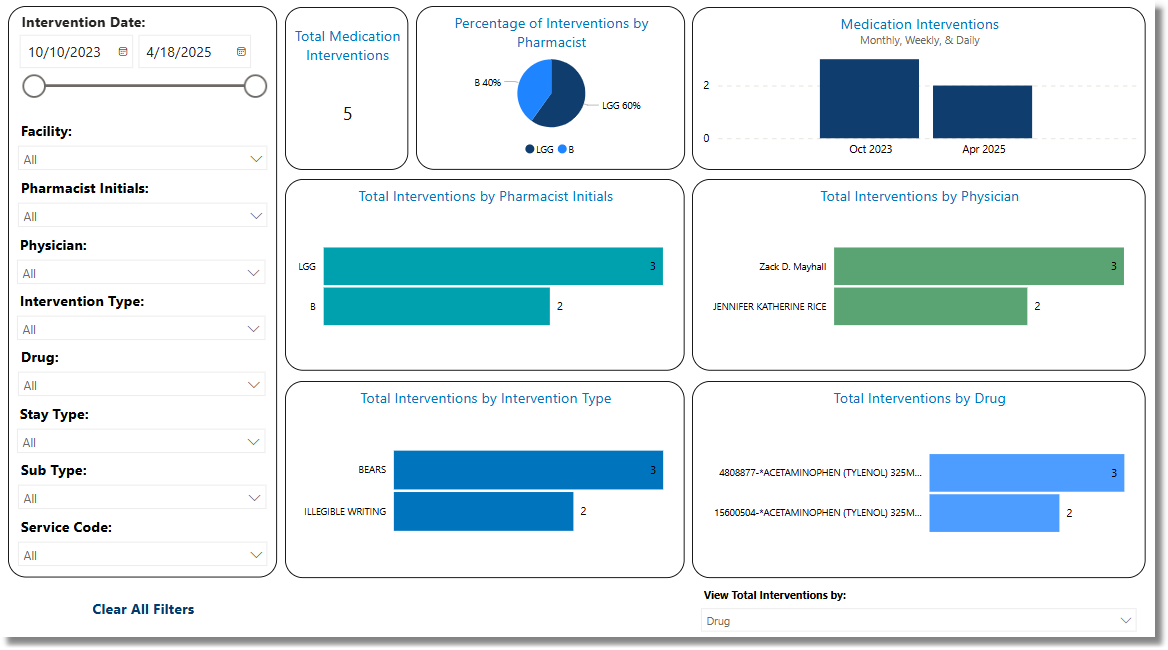
The Medication Interventions Dashboard offers detailed insights into pharmacist-led interventions related to medication management and patient care. It displays the total number of medication interventions and provides comprehensive breakdowns including the percentage and total number of interventions by pharmacist, total interventions by physician, intervention type, and drug. This dashboard enhances medication safety and promotes effective collaboration between pharmacists and providers.
Select Web Client > Report Dashboard > Interactive Reports & Dashboards > Medication Interventions
Medication Interventions
Metrics
•Total Medication Interventions: The number of outcomes due to intervention.
Filters
Filters can be applied to refine the dashlet totals. Each filter features a drop-down menu with a built-in search field, allowing for efficient selection of specific criteria.
•Intervention Date: Use the calendar or slider to specify an Intervention Date range to be used.
•Facility: Use the drop-down menu to select a specific facility.
•Pharmacist Initials: Use the drop-down menu to select a specific pharmacist's initials.
•Physician: Use the drop-down menu to select a specific physician.
•Intervention Type: Use the drop-down menu to select a specific Intervention Type.
•Drug: Use the drop-down menu to select a specific drug.
•Stay Type: Use the drop-down menu to select a specific Stay Type.
•Sub Type: Use the drop-down menu to select a specific Sub Type.
•Service Code: Use the drop-down menu to select a specific Service Code.
•Clear All Filters: Select this option to clear all previously applied filters.
NOTE: If no filters are selected, the data will populate using the default setting of All.
Slicers
The following slicers are available to further refine the corresponding dashlets:
•Intervention Status
▪Completed
▪Pending
•View Total Interventions by:
▪Drug
▪Stay Type
▪Sub Type
▪Service Code
▪Outcome Due to Intervention
▪Outcome Without Intervention