|
<< Click to Display Table of Contents >> Interactive Features |
  
|
|
<< Click to Display Table of Contents >> Interactive Features |
|
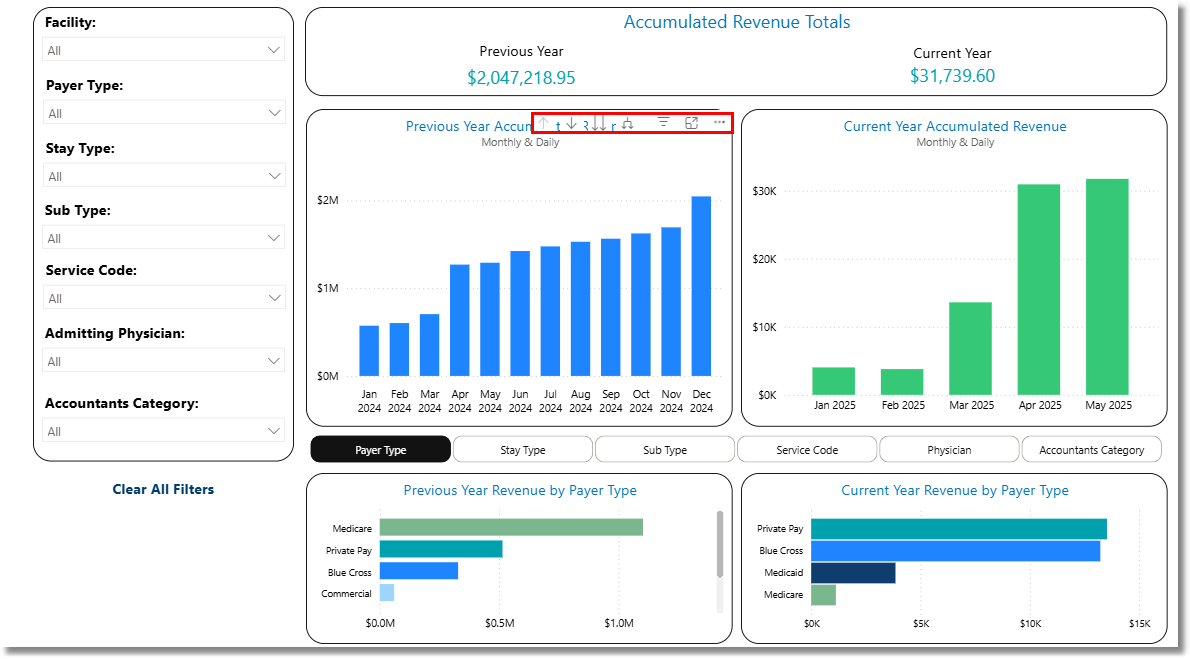
Within a dashboard, hovering over various areas of a dashlet may offer additional interactive features. These options are dependent upon the dashlet being viewed and can vary based on the data it populates. Below is a list of potential options:
Navigational Features
Navigational Features
When hovering over the title of a dashlet, the below navigational features may become available:
•![]() Selecting this option will drill up to a higher level of the displayed data.
Selecting this option will drill up to a higher level of the displayed data.
•![]() Selecting this option will drill down to a deeper level of the displayed data.
Selecting this option will drill down to a deeper level of the displayed data.
•![]() Selecting this option will go to the next level in the hierarchy.
Selecting this option will go to the next level in the hierarchy.
•![]() Selecting this option will expand all down one level in the hierarchy.
Selecting this option will expand all down one level in the hierarchy.
•![]() Selecting this option will display the filters and slicers that are affecting the displayed data.
Selecting this option will display the filters and slicers that are affecting the displayed data.
•![]() Selecting this option will turn on Focus Mode which will enlarge the selected graph.
Selecting this option will turn on Focus Mode which will enlarge the selected graph.
•![]() Selecting this option will provide drill through data on screen for the selected area.
Selecting this option will provide drill through data on screen for the selected area.
•![]() Selecting this option will reveal additional options:
Selecting this option will reveal additional options:
▪Export data: Select this option to choose an export method for the populated data. Once data is exported, users are responsible for any PHI in within that data.
▪Show as a table: Select this option to display a table containing the details that make up the graph.
▪Spotlight: Select this option to highlight the graph within the dashboard.
▪Get insights: This option is for future development.
▪Sort axis: Select this option to adjust how the axis data is sorted in the graph.
oSort descending: Select this option to sort the data in descending order (Z-A).
oSort ascending: Select this option to sort the data in ascending order (A-Z).
Tool Tip
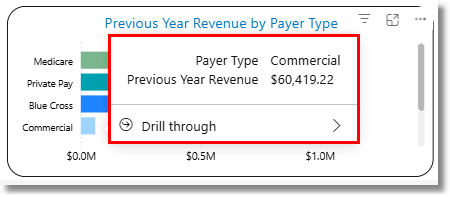
Tooltips
Tooltips may become available when hovering over a portion of a graph on a dashlet. The tooltip will display more precise data for the selected portion of the graph.