|
<< Click to Display Table of Contents >> Patient Peak Times |
  
|
|
<< Click to Display Table of Contents >> Patient Peak Times |
|
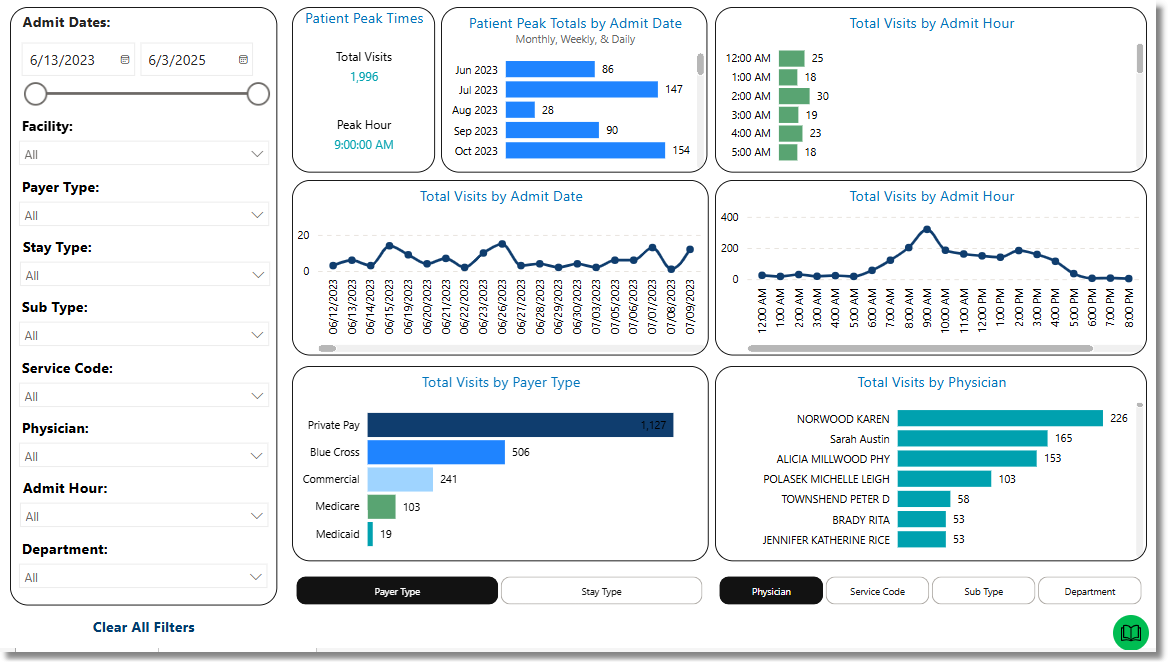
The Patient Peak Times Dashboard displays the total number of patient visits and identifies the peak admission hour within a specified Admit Date range. It also provides detailed breakdowns of visit totals by Admit Date, Admit Hour, Payer Type, Stay Type, Physician, Service Code, and Sub Type. This information helps identify patterns in patient flow to support more effective planning and resource management.
Select Web Client > Report Dashboard > Interactive Reports & Dashboards > Patient Peak Times
Patient Peak Times
Filters
Filters can be applied to refine the dashlet totals. Each filter features a drop-down menu with a built-in search field, allowing for efficient selection of specific criteria.
•Admit Date: Use the calendar or slider to specify an Admit Date range to be used.
•Facility: Use the drop-down menu to select a specific facility.
•Payer Type: Use the drop-down menu to select a specific Payer Type.
•Insurance Company: Use the drop-down menu to select a specific payer by Insurance Company Name.
•Stay Type: Use the drop-down menu to select a specific Stay Type.
•Sub Type: Use the drop-down menu to select a specific Sub Type.
•Service Code: Use the drop-down menu to select a specific Service Code.
•Physician: Use the drop-down menu to select a specific physician.
•Admit Hour: Use the drop-down menu to select a specific Admit Hour.
•Clear All Filters: Select this option to clear all previously applied filters.
NOTE: If no filters are selected, the data will populate using the default setting of All.
Slicers
The following slicers are available to further refine the data displayed in the corresponding dashlets:
•Payer Type
•Insurance Company
•Stay Type
•Physician
•Service Code
•Sub Type
•Department