|
<< Click to Display Table of Contents >> Revenue Dashboard |
  
|
|
<< Click to Display Table of Contents >> Revenue Dashboard |
|
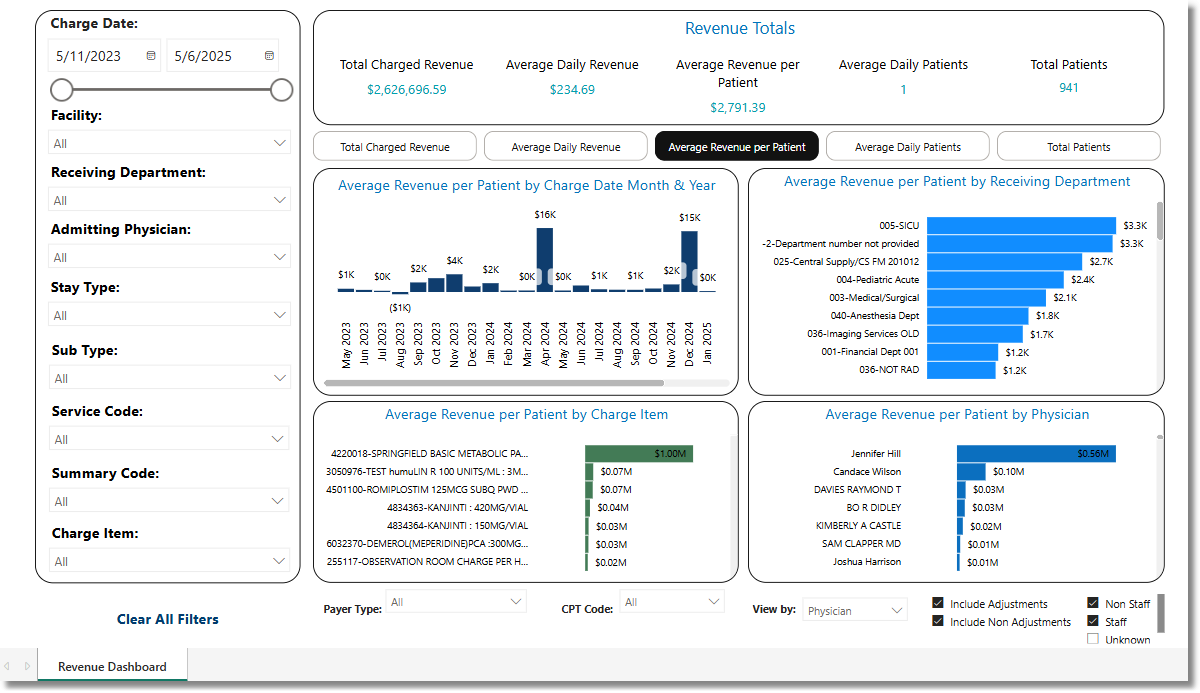
The Revenue Dashboard provides insight and analysis into the revenue generated by different departments within the facility. Providing breakdowns of Total Charged Revenue, Average Daily Revenue, Average Revenue per Patient, Average Daily Patients and Total Number of Patients.
Select Web Client > Report Dashboard > Interactive Reports & Dashboards > Revenue
Revenue
Filters
Filters can be applied to refine the dashlet totals. Each filter features a drop-down menu with a built-in search field, allowing for efficient selection of specific criteria.
•Charge Date: Use the calendar or slider to specify the Charge Date Range to be used.
•Facility: Use the drop-down menu to select a specific facility.
•Receiving Department: Use the drop-down menu to select specific a Receiving Department.
•Admitting Physician: Use the drop-down menu to select a specific Admitting Physician.
•Stay Type: Use the drop-down menu to select a specific Stay Type.
•Sub Type: Use the drop-down menu to select a specific Sub Type.
•Service Code: Use the drop-down menu to select a specific Service Code.
•Summary Code: Use the drop-down menu to select a specific Summary Code.
•Charge Item: Use the drop-down menu to select specific charge items.
•Insurance Company: Use the drop-down menu to select a specific payer by Insurance Company Name.
•Clear All Filters: Select this option to clear all previously applied filters.
NOTE: If no filters are selected, the data will populate using the default setting of All.
Slicers
The following slicers are available to further customize the dashlets:
•Total Charged Revenue
•Average Daily Revenue
•Average Revenue per Patient
•Average Daily Patients
•Total Patients
•Payer Type:
▪Blue Cross
▪Commercial
▪Medicaid
▪Medicare
▪Private Pay
•CPT Code
•Modifier
•View by:
▪Physician
▪Stay Type
▪Sub Type
▪Service Code
▪Summary Code
▪Payer Type
▪CPT Code
•Include Adjustments
•Include Non Adjustments
•Non Staff
•Staff
•Unknown