|
<< Click to Display Table of Contents >> Scheduled Appointments |
  
|
|
<< Click to Display Table of Contents >> Scheduled Appointments |
|
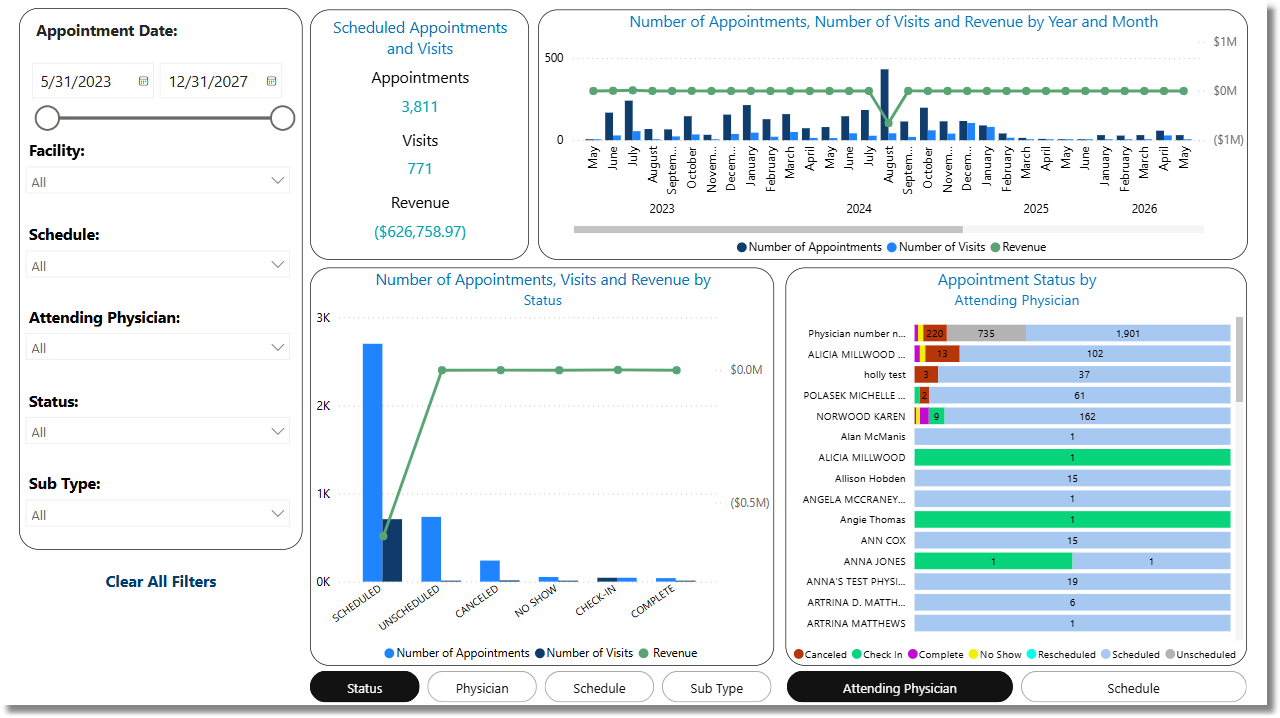
The Scheduled Appointments Dashboard provides insights into appointment scheduling, utilization, and associated revenue within a specified appointment date range. It displays key metrics including the total number of appointments, total visits, and total revenue.
Select Web Client > Report Dashboard > Interactive Reports & Dashboards > Scheduled Appointments
Scheduled Appointments
Metrics
•Appointments: The number of appointments scheduled within the specified date range.
•Visits: The number of visits that have been linked to appointments scheduled within the specified date range.
•Revenue: The total revenue from visits that have been linked to appointments scheduled within the specified date range.
Filters
Filters can be applied to refine the dashlet totals. Each filter features a drop-down menu with a built-in search field, allowing for efficient selection of specific criteria.
•Appointment Date: Use the calendar or slider to specify an Appointment Date range to be used.
•Facility: Use the drop-down menu to select a specific facility.
•Schedule: Use the drop-down menu to select a specific schedule to be used. The dashboard will display all appointments and visits associated with the selected schedule location.
•Attending Physician: Use the drop-down menu to select a specific attending physician to be used. The dashboard will display only appointments that have visits associated with the selected physician.
•Status: Use the drop-down menu to select a specific appointment status.
•Sub Type: Use the drop-down menu to select a specific Sub Type.
•Appointments with Visits: Use the drop-down menu to select appointments with or without visits.
•Clear All Filters: Select this option to clear all previously applied filters.
NOTE: If no filters are selected, the data will populate using the default setting of All.