|
<< Click to Display Table of Contents >> Most Common Diagnoses |
  
|
|
<< Click to Display Table of Contents >> Most Common Diagnoses |
|
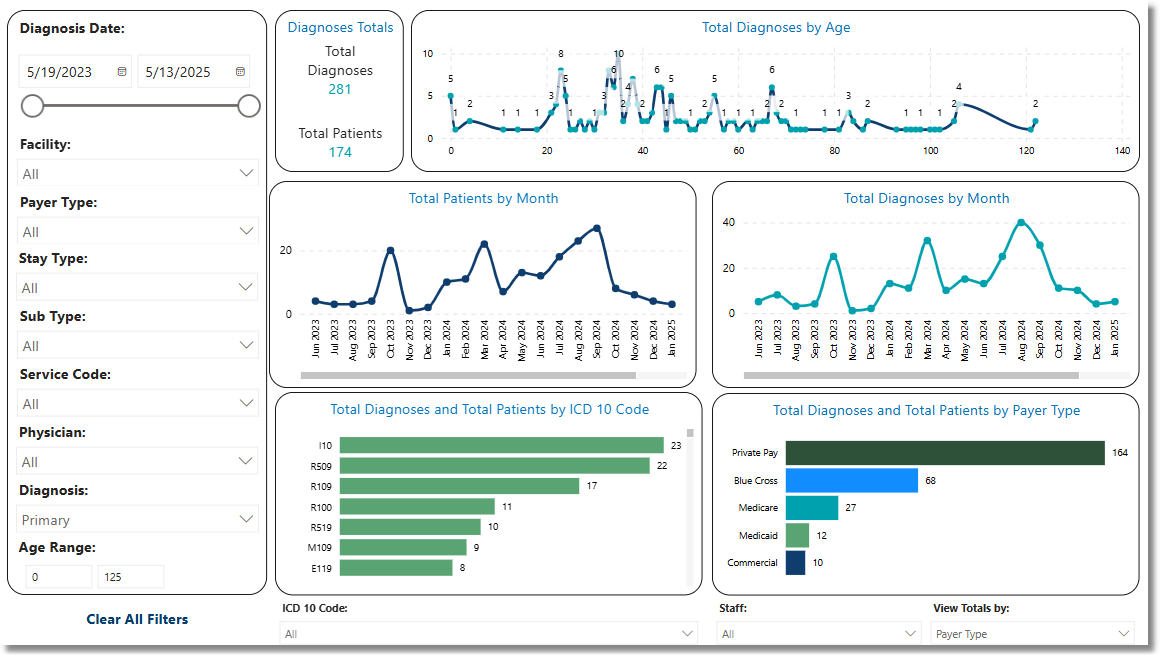
The Most Common Diagnoses Dashboard provides insights into the distribution of diagnoses recorded by providers across the organization. It displays the total number of diagnoses and the total number of patients within a specified diagnosis date range, with monthly breakdowns for trend analysis. Additionally, data can be further filtered by specific ICD10 Code, Staff vs Non-Staff Physicians, and Payer Type, Stay Type, Sub Type, Service Code, allowing for detailed and targeted analysis.
Select Web Client > Report Dashboard > Interactive Reports & Dashboards > Most Common Diagnoses
Most Common Diagnoses
Metrics
•Total Diagnoses: Total count of coded ICD-10 diagnosis codes from patient stays.
•Total Patients: Total count of patients with unique profile numbers.
Filters
Filters can be applied to refine the dashlet totals. Each filter features a drop-down menu with a built-in search field, allowing for efficient selection of specific criteria.
•Diagnosis Date: Use the calendar or slider to specify an Diagnosis Date range to be used.
•Facility: Use the drop-down menu to select a specific facility.
•Payer Type: Use the drop-down menu to select a specific Payer Type.
•Insurance Company: Use the drop-down menu to select a specific Insurance Company.
•Stay Type: Use the drop-down menu to select a specific Stay Type.
•Sub Type: Use the drop-down menu to select a specific Sub Type.
•Service Code: Use the drop-down menu to select a specific Service Code.
•Physician: Use the drop-down menu to select a specific physician.
•Diagnosis: Use the drop-down menu to select a specific Diagnosis.
•Age Range: Use the fields to specify a specific age range to be used.
•Clear All Filters: Select this option to clear all previously applied filters.
NOTE: If no filters are selected, the data will populate using the default setting of All.
Slicers
The following slicers are available to further refine the corresponding dashlets:
•ICD10 Code
▪Primary Only
•Staff
▪Non Staff
▪Staff
•View Totals by:
▪Payer type
▪Insurance Company
▪ICD 10 Code
▪Stay Type
▪Sub Type
▪Service Code
▪Physician